Few areas involve, generate, and celebrate data in the manner that sports does. Almost any sport, be it individual or team, produces large amounts of data as the result of matches, data that lend themselves to statistical analysis.

This area of sports analytics continues to gain popularity and is perhaps most connected to the sport of baseball, largely through the work of people like Bill James and books and films such as Moneyball. More recently, other sports, including basketball, soccer, professional football, ice hockey, tennis, and golf have begun to be the focus of analytics research.

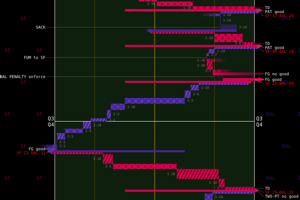
Surprisingly, there have been few applications of visualization presentation and exploration tools to sports data. General purpose displays, interaction techniques, and tools like Tableau are often used to present simple views of sports data, but complex structure and relationships in the data frequently necessitate approaches that leverage domain knowledge. Some sports-specific visualizations exist (for example, the commonly used basketball shot chart), but they have largely remained stagnant. Special-purpose tools that allow people to explore and analyze sports data interactively could not only enhance the enjoyment of fans, but also assist media coverage and team officials' decision making.

This workshop will serve as the first meeting of researchers and practitioners interested in presenting sports data through visualization. It will provide an opportunity for those engaged in this topic to interact and share their experiences. Hopefully, it will spur growth in a new sub-area of data visualization for the future.
Organizers
Rahul Basole, Georgia Institute of Technology
Edward Clarkson, Georgia Tech Research Institute
Andy Cox, The Weather Company and Crashing the Dance
Christopher Healey, North Carolina State University
John Stasko, Georgia Institute of Technology
Chad Stolper, Georgia Institute of Technology